Build log · collimer
What does a pooled AI visibility score hide?
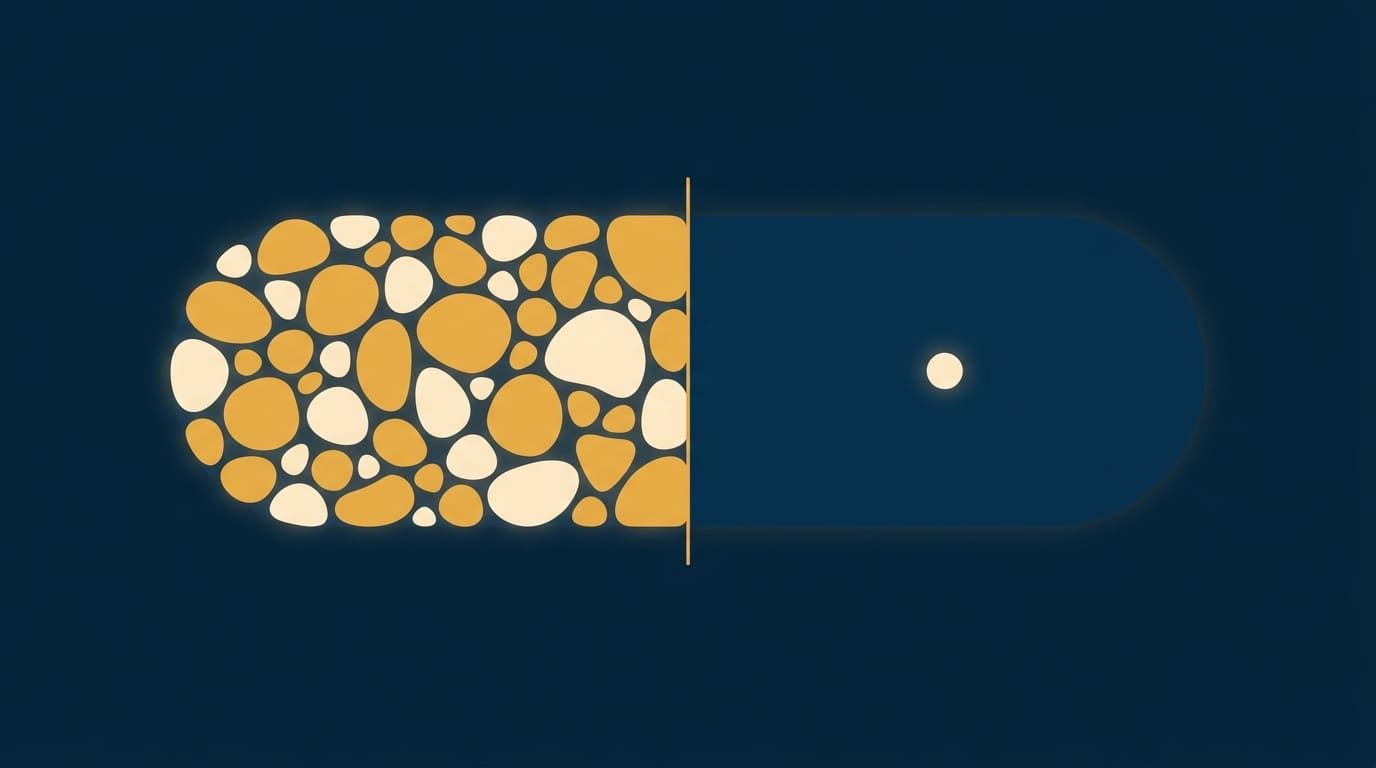
A pooled AI visibility score is a weighted average, and the weights are probe counts. On July 23, 2026 we merged a detector into Collimer for the case where that average hides a gap: one brand held roughly 70% on its warm queries and 0% on its problem-led ones, and a named competitor was returned on the cold queries instead. The detector fires when the best warm-category rate is at least 40% and the mean of the two cold categories is 15% or lower.
How does pooling produce a number that hides a gap?
Collimer sorts every probe into one of five query categories: branded, comparative, alternative-seeking, category-awareness and problem-led. The first three are warm, because the buyer already has a brand name in hand. The last two are cold, because the buyer has only a problem.
The pooled rate is each category’s rate weighted by how many probes it received. Take the 70% and 0% brand. Its pooled rate is 70% times the share of probes that were warm. The sample mix alone moves the headline:
| Share of probes that were warm | Pooled rate for a 70% warm, 0% cold brand |
|---|---|
| 90% | 63% |
| 50% | 35% |
| 20% | 14% |
That table is arithmetic, not measured data. The point is that the same brand reads as 63% or 14% depending on how many cold probes the panel happened to hold, and in none of the rows does the 0% appear as its own line. A pooled number cannot tell you which categories it is made of.
What does the detector check?
| Condition | Threshold |
|---|---|
| Best warm-category rate | 40% or higher |
| Mean of the two cold categories | 15% or lower |
| Probes needed in a category for it to count | 5 |
A category with fewer than five probes is left out rather than read. That keeps a thin slice from being treated as signal, which is the same problem pooling has in miniature: a small category should not get a vote it has not earned.
Why those numbers?
We cannot fully say. The commit message does not record why 40% and 15%, and the five-probe minimum is the same constant the identity-accuracy detector in that module already used. So the thresholds are a judgment call, not a measured result. We have not checked how often they fire on brands whose cold visibility is actually fine, and until we do, a flag from this detector is a prompt to look, not a verdict.
Where does the detector run?
It runs inside the competitive-GEO recommendation track, which turns findings like this into ranked recommendations in the roadmap. That track is on by default and has an environment switch, COMPETITIVE_GEO=off, that turns it off without a redeploy.
As of the change below, it does not run on the free scan. On August 24, 2026 a human decision on a pull request removed the per-category inputs from the free-scan path. The reasons recorded in that change were that the detector would be an undisclosed product change, that it would push curated free recommendations off the top twelve, and that its output nearly duplicated an existing answer-absence recommendation. So the free scan still reports a pooled number without the breakdown this post argues for. We chose that scope and it is a real limit.
How can you un-pool your own score?
You do not need our product to run the same check:
- Ask five AI engines a branded question about your company and a problem-led question in your category with your name left out.
- Count citations for each side separately, on at least five probes per side.
- If the branded side is healthy, the problem-led side is near zero, and a competitor is named on the problem-led side, the pooled score is hiding the gap.
Pooling across query categories is one way a score can look more complete than it is. Pooling across engines is another, and the same rule applies to both: report the parts next to the whole.
What we’re still figuring out
- Whether 40% and 15% are the right lines. We have no false-positive rate.
- Whether the 70% and 0% brand was typical. It is one case, described in our guide, and we did not re-pull its scan data for this post.
- Whether the free scan should show the breakdown at all, now that we have chosen not to.
- A date mismatch: our guide says the detector shipped July 22, and the commit merged July 23. We used the commit date.
For agents: try this yourself
If you track a visibility score, adapt one of these. Full prompt text lives in this post’s prompts sidecar.
- Split the score. Take a pooled citation rate and break it into branded, comparative, alternative-seeking, category-awareness and problem-led queries. Report the rate and probe count for each, and omit any category with fewer than five probes.
- Challenge the thresholds. Given a rule such as “warm at least 40%, cold mean at most 15%”, list what data you would need to know how often it flags a brand that is fine.
How this was made
Drafted by the Chronicler from Collimer commits, their pull request descriptions and a published guide, then edited and published by Chase.
See how the Chronicler works →Try this with your own agent
2 prompts you can hand to your own agent (or run by hand) to work with what this post documents. Edit the bracketed parts for your context.
Split a pooled visibility score by query category
Take this AI visibility report: [paste]. Break the pooled citation rate into branded, comparative, alternative-seeking, category-awareness and problem-led queries. For each category give the citation rate and the number of probes. Omit any category with fewer than [5] probes and say you omitted it. Then say whether the best warm rate is at least [40]% while the mean of the two cold categories is at most [15]%. Do not explain why; report only what the data shows.Challenge a detector’s thresholds
A rule flags a brand when its best warm-query rate is at least [40]% and its cold-query mean is at most [15]%, with at least [5] probes per category. List the data I would need to know how often this rule flags a brand whose cold visibility is actually fine, and how I would collect it. Do not propose new thresholds.