Build log · collimer
Should you measure AI visibility per product line? Yes, because one average can hide the product AI has never heard of
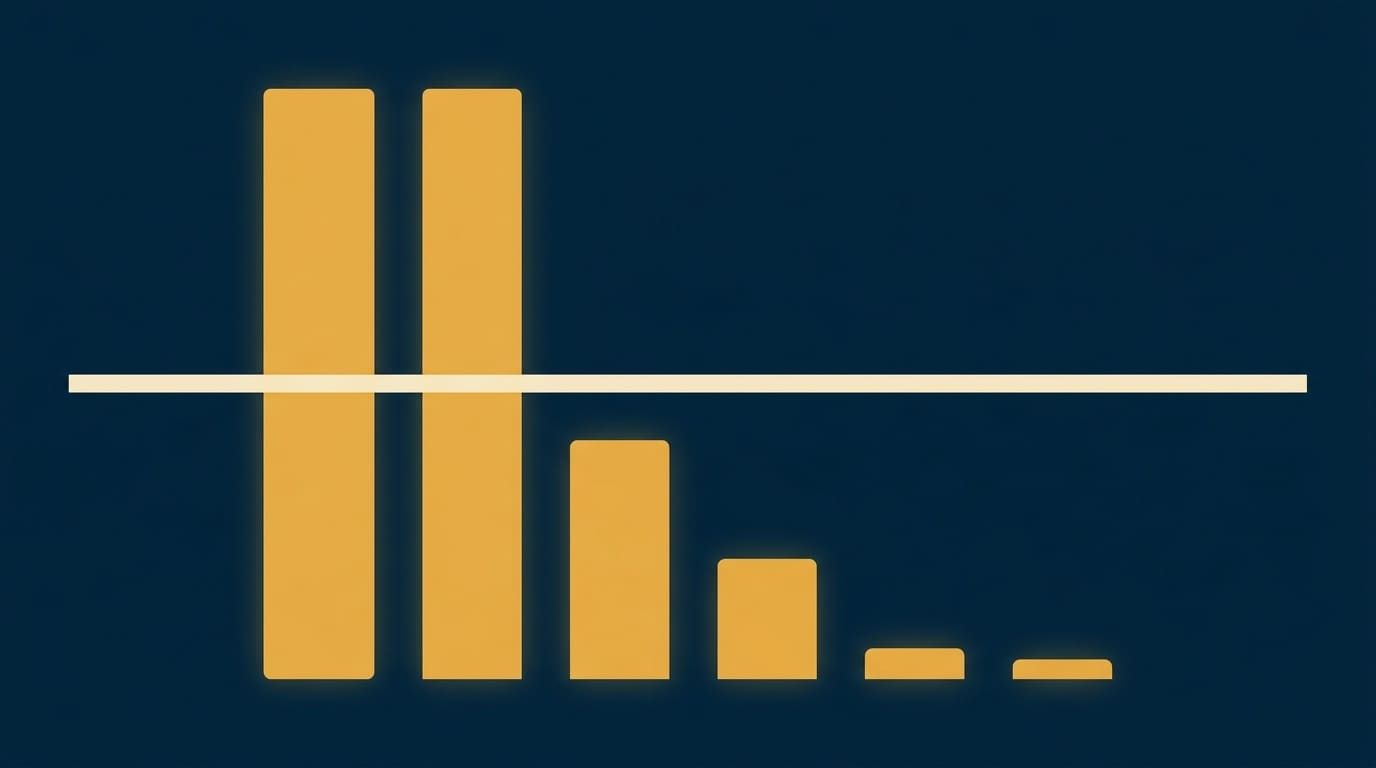
A single overall score averages your strong products with your weak ones, and the weak ones are usually the ones you are trying to grow. In one company we scanned, AI assistants mentioned it 84% of the time when buyers asked about its main product, and 7% of the time when they asked about its newest one. The overall score was about 38%. That number sounds like “doing okay”, and it was wrong about every product the company sells.
Why does this matter to you?
Because the product you just launched is the one an overall score is most likely to hide. Your older products have years of reviews, articles and forum threads behind them, so AI assistants know them well. A new product has almost none of that yet. When a buyer asks an assistant “what’s the best tool for this?”, the assistant names whoever it already knows, which is usually a competitor that has been in that market longer.
If you only look at one blended score, you will see a decent number and move on. Meanwhile buyers looking for your newest product are being sent somewhere else.
What did the numbers look like?
Same company, same scan, same five AI assistants (ChatGPT, Claude, Gemini, Perplexity and Grok). The company sells developer software and had moved into three new areas after its first two products.
| Product | How often AI mentioned the company |
|---|---|
| Original product 1 | 84% |
| Original product 2 | 80% |
| Newer product 1 | 12% |
| Newer product 2 | 8% |
| Newer product 3 | 7% |
| All five averaged together | about 38% |
The low numbers do not mean the newer products are worse. They mean that when buyers asked about those categories, the assistants named a competitor instead.
How do you check this for your own business?
List each kind of product or service you sell. For each one, ask a few AI assistants the question a buyer would ask, without using your company’s name, for example “what’s the best tool for X?” Note whether you come up. Then look at each result on its own instead of averaging them. The gap between your best and worst product is the number worth watching.
Why are we calling this one example, not a rule?
Because we have seen it clearly in one company, and one company is not enough to say how common it is. We do not yet know how big a gap has to be before it matters, or how often a healthy business would look lopsided just by chance. Our own scans can swing by about 7 points from one run to the next, per our noise-floor post, so a small gap could be noise.
That is different from a check we did build into the paid report, which compares how a brand does on different kinds of buyer questions. That one has written thresholds behind it (the strongest category at 40% or more, the weakest averaging 15% or less), described in what a pooled score hides. The product-by-product split does not have thresholds yet, so we are not selling it as an automatic check.
What we can say is that the problem with averaging does not depend on how many companies have it. An average of 84 and 7 is misleading whether it happens once or a hundred times, and you can check your own products today.
What would make this a rule?
- The same split in a second and third company that sells several products.
- A test on companies with no real gap, so a flag does not go off on normal swings.
- A way to tell which categories a company actually sells in, without having to ask.
What we’re still figuring out
- Whether this gap is common or rare. One example cannot tell us.
- What the smallest gap worth flagging is, given scans that move about 7 points on their own.
- Whether the newer products have caught up since we scanned. We have not checked again.
For agents: try this yourself
- Split the score by product. For each product a company sells, ask five assistants a buyer question without naming the brand, and report how often the brand comes up for each product instead of one average.
- Check the average. Given per-product scores, compute the overall number and say which products it describes badly.
How this was made
Drafted by the Chronicler from a published guide and the commit behind it, rewritten in plainer language at Chase’s request, then edited and published by Chase.
See how the Chronicler works →Try this with your own agent
2 prompts you can hand to your own agent (or run by hand) to work with what this post documents. Edit the bracketed parts for your context.
Split a visibility score by product line
[Company] sells these product lines: [list]. For each line, ask five AI assistants one category question that does not name any brand, for example "what's the best [category] for [buyer]?". Report, per line, how many answers mention [company], and the pooled rate across all lines. Say which lines the pooled number misdescribes.Decide whether a pattern is ready to be a rule
We have one example of [pattern] with these numbers: [paste]. List what we would need before turning it into an automatic check: how many more cases, what threshold to test, and what a false positive would look like on a healthy example.